📈 Freight Reports
Reports is where your freight history turns into figures you can read — cost, delivery speed, and where your consignments go — grouped whichever way suits the question you are asking. This page will guide you through finding Reports, setting the shared filters, and working through each of the six tabs, so you can pull the number you need and share it without building a spreadsheet first.
In the app, Reports sits under "Tracking" in the sidebar's "Track" group, with the subtitle "Freight cost reporting by carrier, client, or location". Access is granted per person: if a team member cannot see Reports, the account owner or an admin needs to grant them the Reports module. This ensures the cost figures stay in front of only the people who should see them.
Setting the filters
Four of the tabs — "Spend", "Speed", "Distribution", and "Daily" — share a filter bar across the top. You set it once, then simply press "Run Report".
- "Group By" decides how each row is totalled: "Carrier", "Business", "Client", "Location", "Month", "Service", "Tier", "Carrier + Service", or "Carrier + Tier". It is hidden on "Distribution" and "Daily", which group their own way.
- "Date range" picks the window, with quick presets — this month is the default, along with last 30 days, last quarter, year to date, last year, and all time. On "Daily" this becomes a single "Report day" picker.
- The "Client", "Carrier", "Tier", and "Service" selects narrow the report, each defaulting to "All ...". The last three are hidden on "Daily".
Press "Run Report" to run it. If you change a filter and then switch tabs, the page shows "Filters changed — rerunning the report." and reruns on its own, so what you are looking at always matches the filters you set.
Two buttons sit in the header. "Export CSV" pulls the current report into a spreadsheet, and "Print / PDF" opens your browser's print dialog on just the report — the way to save a PDF on every tab except "Daily", which has its own. Both grey out when there is nothing to show. Neither appears on "Email schedules", and "Activity" has no "Print / PDF".
Reports has six tabs: "Spend" for cost, "Speed" for delivery performance, "Distribution" for where freight goes, "Daily" for one day's consignments per client, "Activity" for an audit trail, and "Email schedules" for sending reports out on a cadence. The first four read from the shared filter bar; the last two do not.
Spend
"Spend" is your freight cost over the chosen window. Stat cards across the top total your "Total Consignments", "Total Consignment Cost", "Quote vs Actual", "Account Charges", and "Grand Total", with a carrier-mix donut and a monthly-spend chart below them. The "Results" table breaks the figures out by your chosen group — "Consignments", "Total Quoted", "Total Actual", "Variance", and "Variance %", plus "Account Charges" and "Grand Total" when you group by carrier — and each row has a "View →" that drills into the consignments behind it. This helps you keep an eye on where your actual charges came in over or under what you were quoted, rather than finding out at invoice time. When nothing matches, the table reads "No data for selected filters".
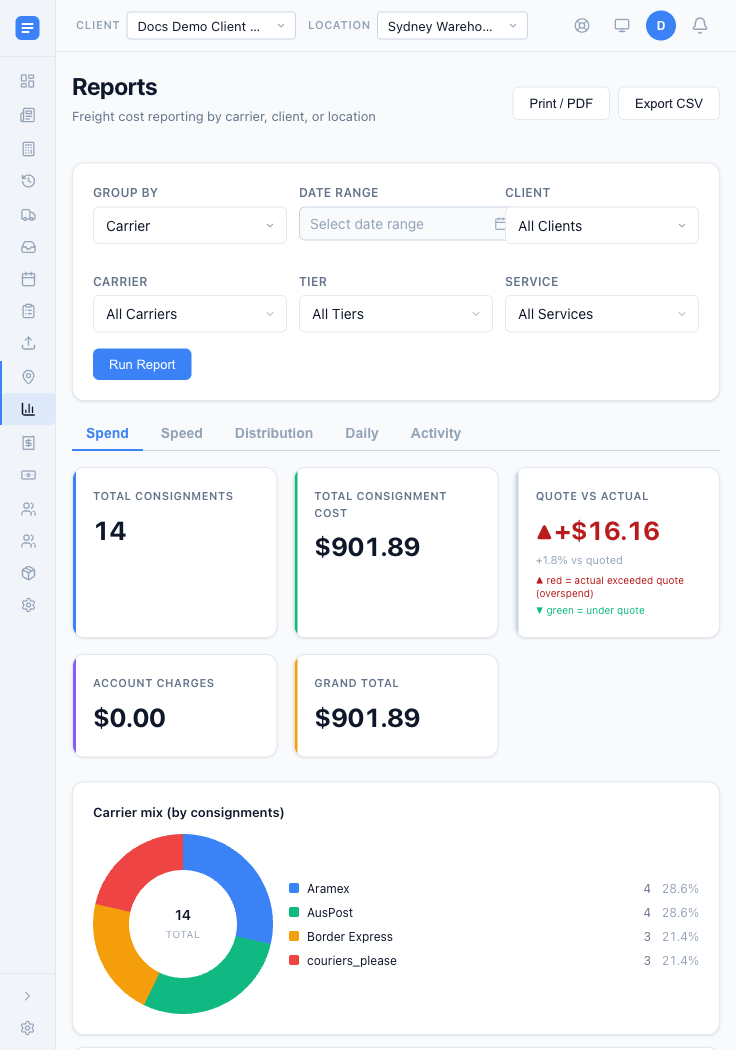 The Spend tab totals your freight cost and sets quote against actual, with a carrier-mix donut below the stat cards.
Speed
"Speed" reads delivery performance. Its cards cover "Total Consignments", "Delivered", "Avg transit time" (first scan to delivered), "Avg pickup delay" (manifest to first scan), and your "Fastest carrier" and "Slowest carrier". The "Results" table adds "Delivered %", "Avg Transit", and "Avg Pickup Delay" per group. Below it, "Route lanes — transit by carrier" lays out one row per from→to postcode pair with a column per carrier, showing median days in each cell and a "Best" column marking the quickest carrier on that lane. A "Min deliveries" input, set to 2 by default, greys out lanes with too few deliveries to trust. Lanes appear only once consignments carrying both postcodes have been scanned and delivered, so the table fills in as you ship.
Distribution
"Distribution" shows where your freight goes — a "Distribution map" heat map of receiver postcodes alongside a "By state" breakdown. A "Date type" toggle switches between "Delivered" and "Created" dates, depending on whether you are asking where things landed or where they were booked to.
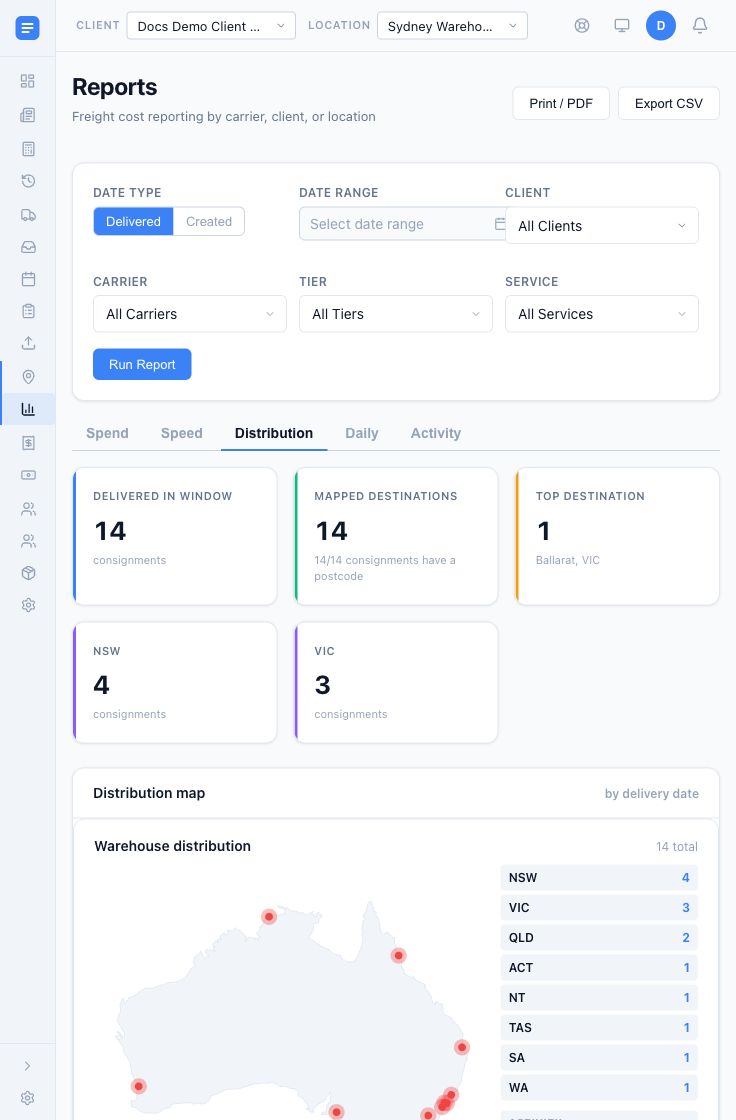 The Distribution map plots receiver postcodes across the country, with a by-state tally beside it.
Running "Distribution" with no date range set asks "No date range is selected. This may load a very large dataset. Continue?". On a busy account that can pull a lot of history at once, so set a range first unless you genuinely need everything.
Daily
"Daily" lists a single day's consignments grouped under each client, chosen with the "Report day" picker. Each row shows the "Ref / Tracking", "From", "To", "Carrier", "Service", "Status", "Qty", "Wt (kg)", "Quoted", and "Actual", with per-client totals and status counts. You can "Export all clients CSV" or "Export all clients PDF", or export a single client with its own "Export CSV" and "Export PDF". The Daily PDF is a properly generated document rather than a print-out, so it is the one to send a client. A very large day is capped at the first 5,000 consignments; narrow to a single client to bring the rest into view.
Activity
"Activity" is an audit trail of what has happened to your consignments — "When", "Action", "User", and the "Consignment" itself, which links straight to the record. A "Load more" button pages back through the history. It is not tied to the filter bar, so it always shows the latest actions across your account.
Email schedules
"Email schedules" sends reports out on a cadence, so the numbers arrive without anyone opening Reports. Press "New schedule" to create one. A schedule carries a name; a cadence of "Daily", "Weekly", or "Monthly" with a send time and timezone; a reporting period such as yesterday, last 7 days, last week, month to date, or last month; a client scope; recipients; and the attachments to include — "Daily report (PDF)", "Spend summary (CSV)", "Route speed (CSV)", or "Receiver distribution (CSV)". Each row shows "Last sent" and an "Enabled" switch, with "Edit", "Send now", and "Delete" to hand. This allows a weekly spend summary or a client's daily report to land in an inbox on its own.
Grouping by service and tier
Grouping by "Service" or "Tier" only lines up cleanly once your carrier services are mapped. "Tier" is what collapses each carrier's equivalent service — Express, Standard, Same-Day, and economy tiers — into a single row across carriers, so you can compare like with like. Consignments whose service is not yet mapped fall into a blank, unknown group, which is why mapping and backfilling matter. You set this up in the "Services" area of Freight Settings, where you can also "Backfill" the mapping over consignments you have already booked.